Using Pitaya-Link with GNU MCU Eclipse
Introduction
GNU MCU Eclipse fully supports pyOCD with an included pyOCD debugging plugin. This guide explains how to configure the local debug toolchain using Pitaya-Link with GNU MCU Eclipse.
Requirements
- A Pitaya-Link Debug Probe
- Eclipse IDE for C/C++ Developers
- An nRF52 target board (e.g. nRF52840 MDK USB Dongle)
Installing Eclipse
You need to install Eclipse CDT with the GNU MCU Eclipse plugins to begin:
- Install Eclipse IDE for C/C++ Developers.
- Open Eclipse.
- Create a workspace directory. This will be separate from your code.
- Install the GNU MCU Eclipse plugin:
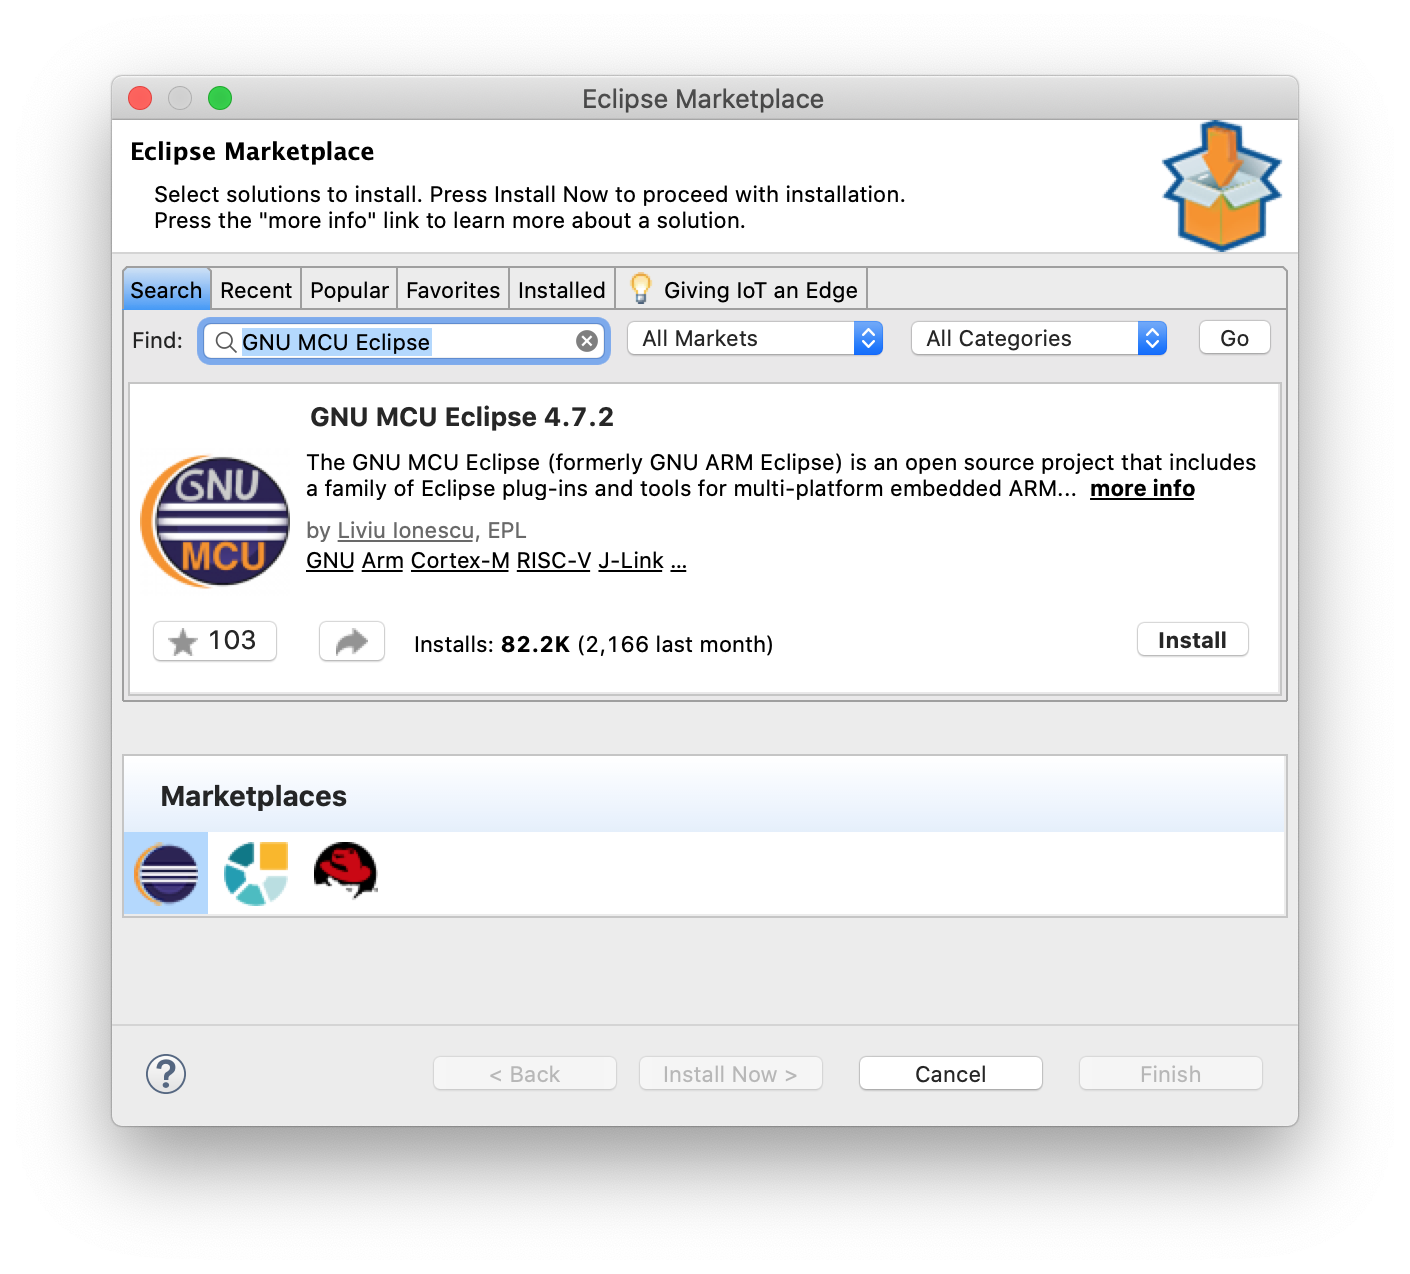
- Click the Help menu item and select Eclipse Marketplace…
- Find GNU MCU Eclipse and install.
- Select GNU MCU Eclipse x.x.x and confirm.
Install pyOCD
The latest stable version of pyOCD may be installed via pip as follows. Skip this step if pyOCD already exists.
pip install -U pyocd
Install GNU Arm Embedded Toolchain
Download and install the GNU ARM Embedded Toolchain. Skip this step if the toolchain already exists.
Importing the project in Eclipse
- Open Eclipse.
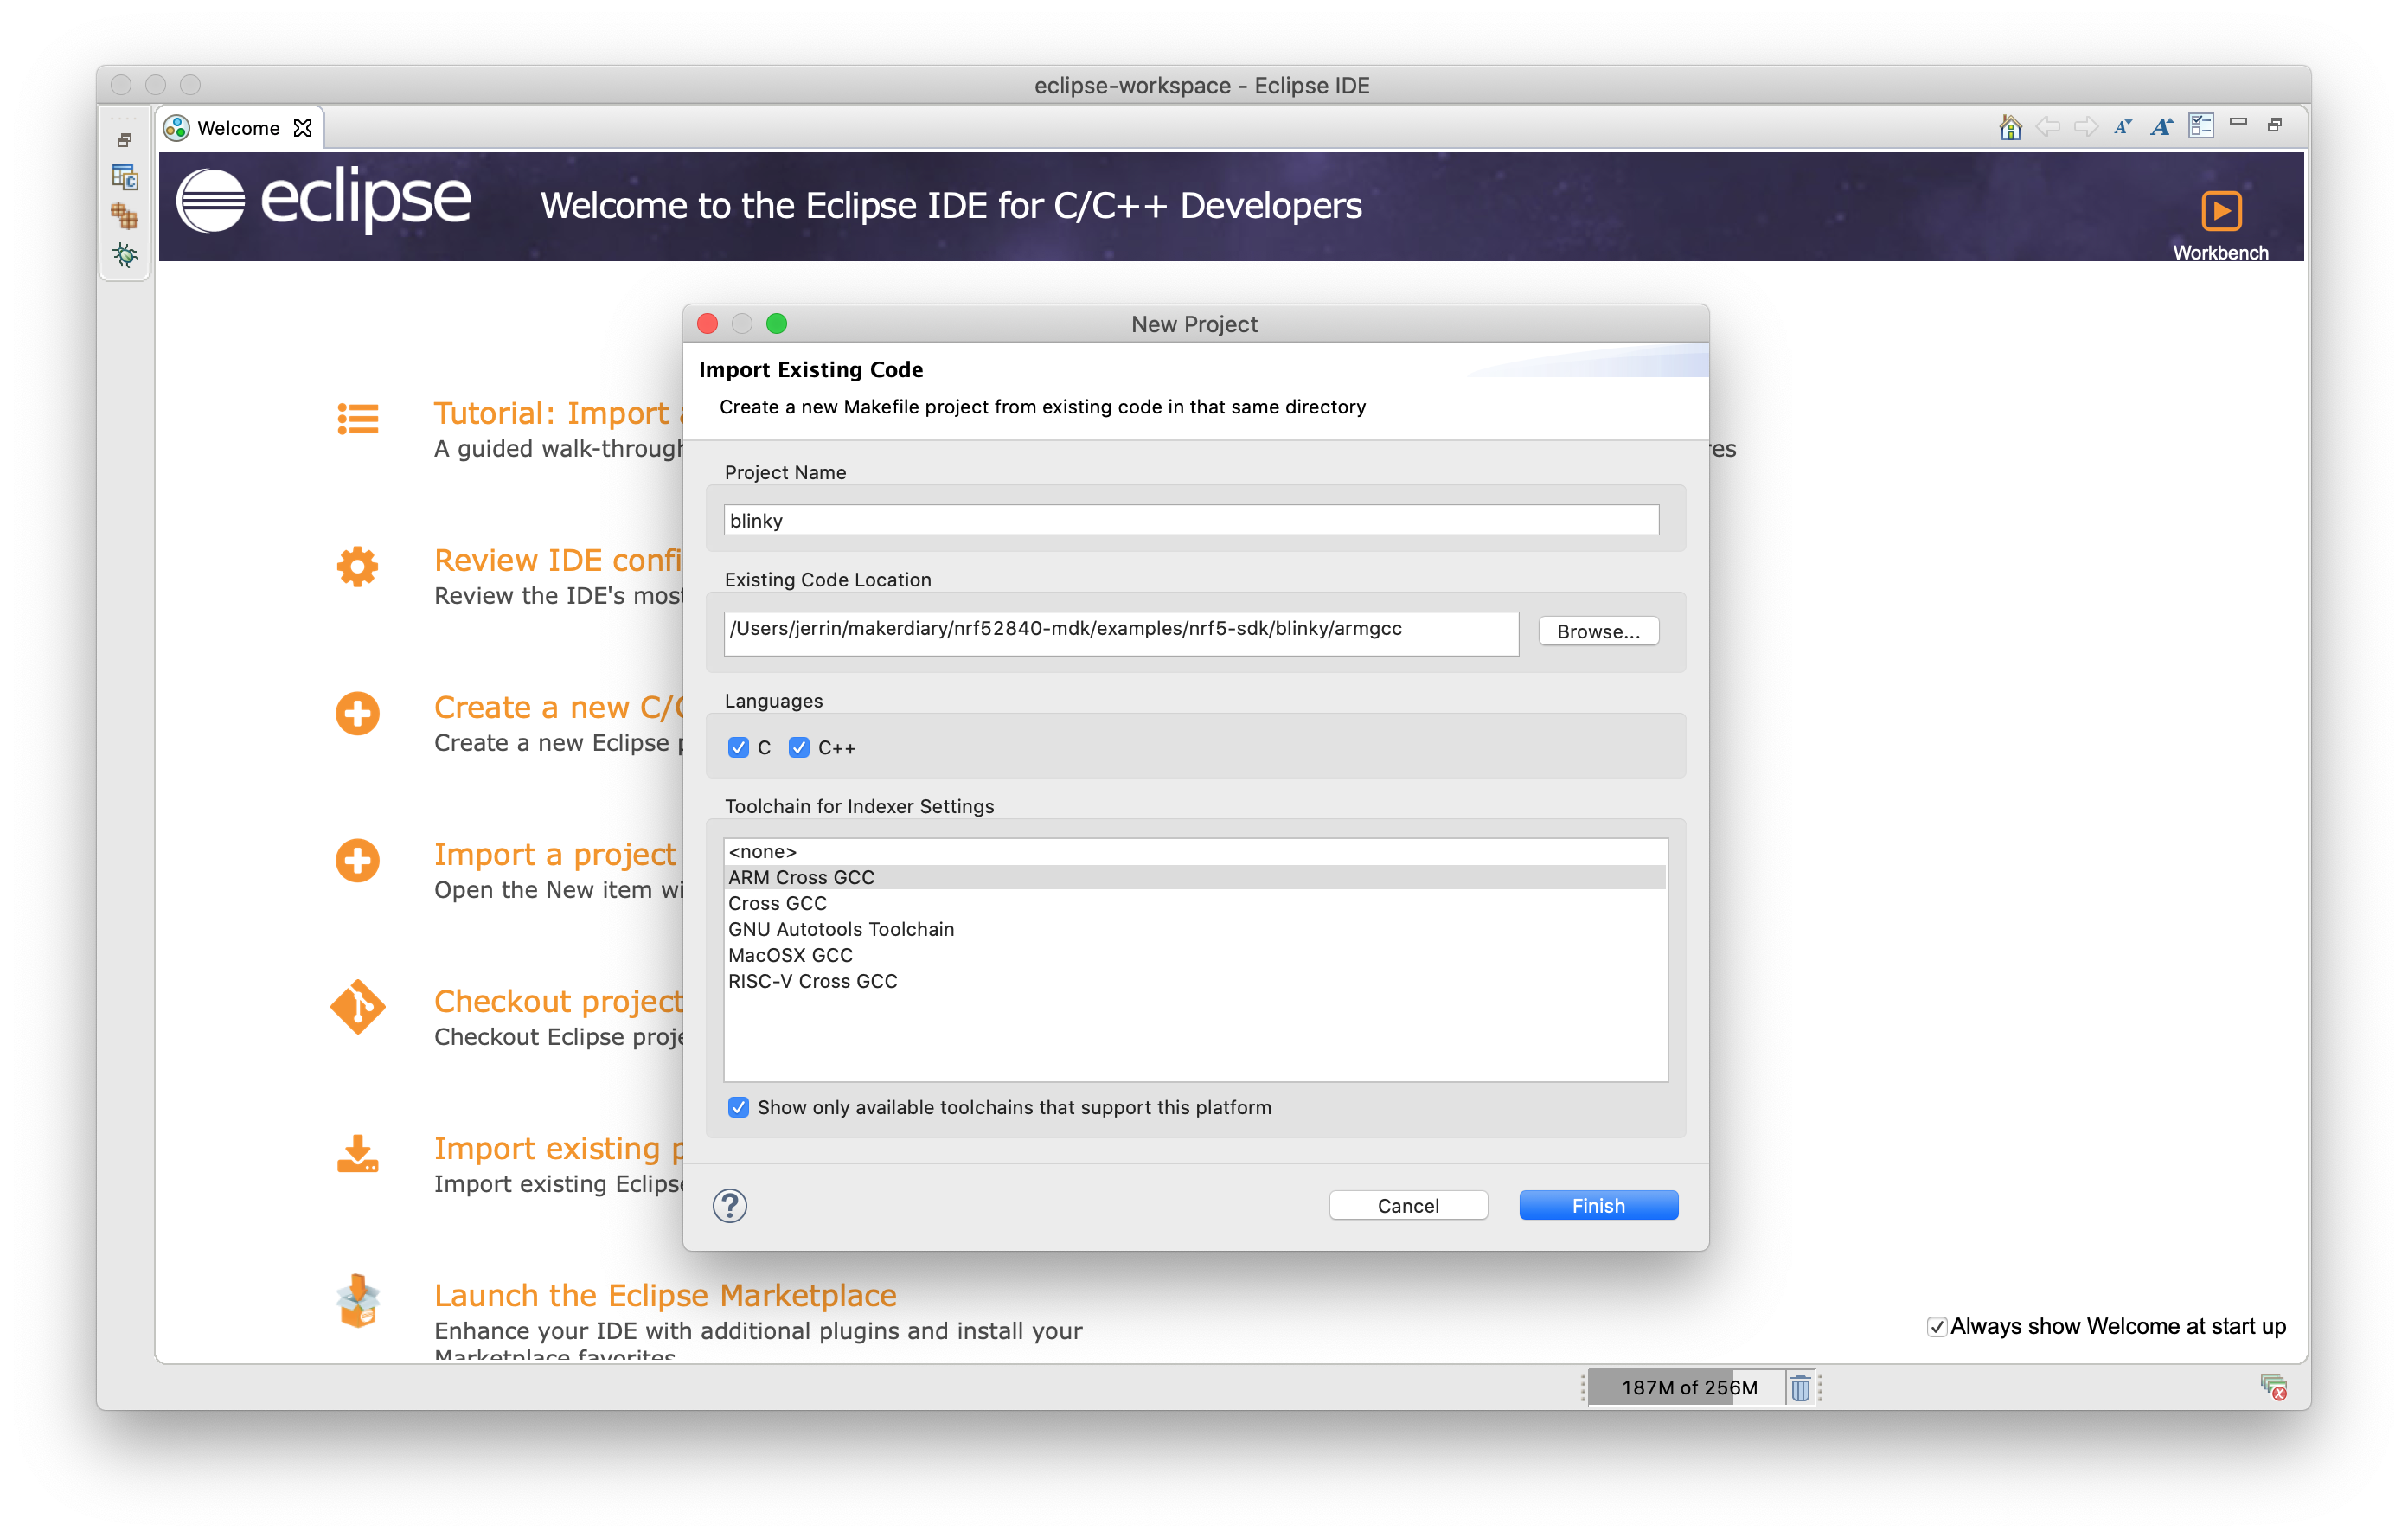
- On the Welcome window, select Import a project with a working Makefile.
- Select the folder to your project with a Makefile. E.g., blinky/armgcc.
- Under Toolchain for Indexer Settings, select
Cross ARM GCC. - Click Finish.
Configuring the debugger
- Select Run > Debug Configurations....
- If no configuration exists under GDB pyOCD Debugging, click on New launch configuration.
-
In the Main tab, select the
.outfile (_build/nrf52840_xxaa.out) under C/C++ Application.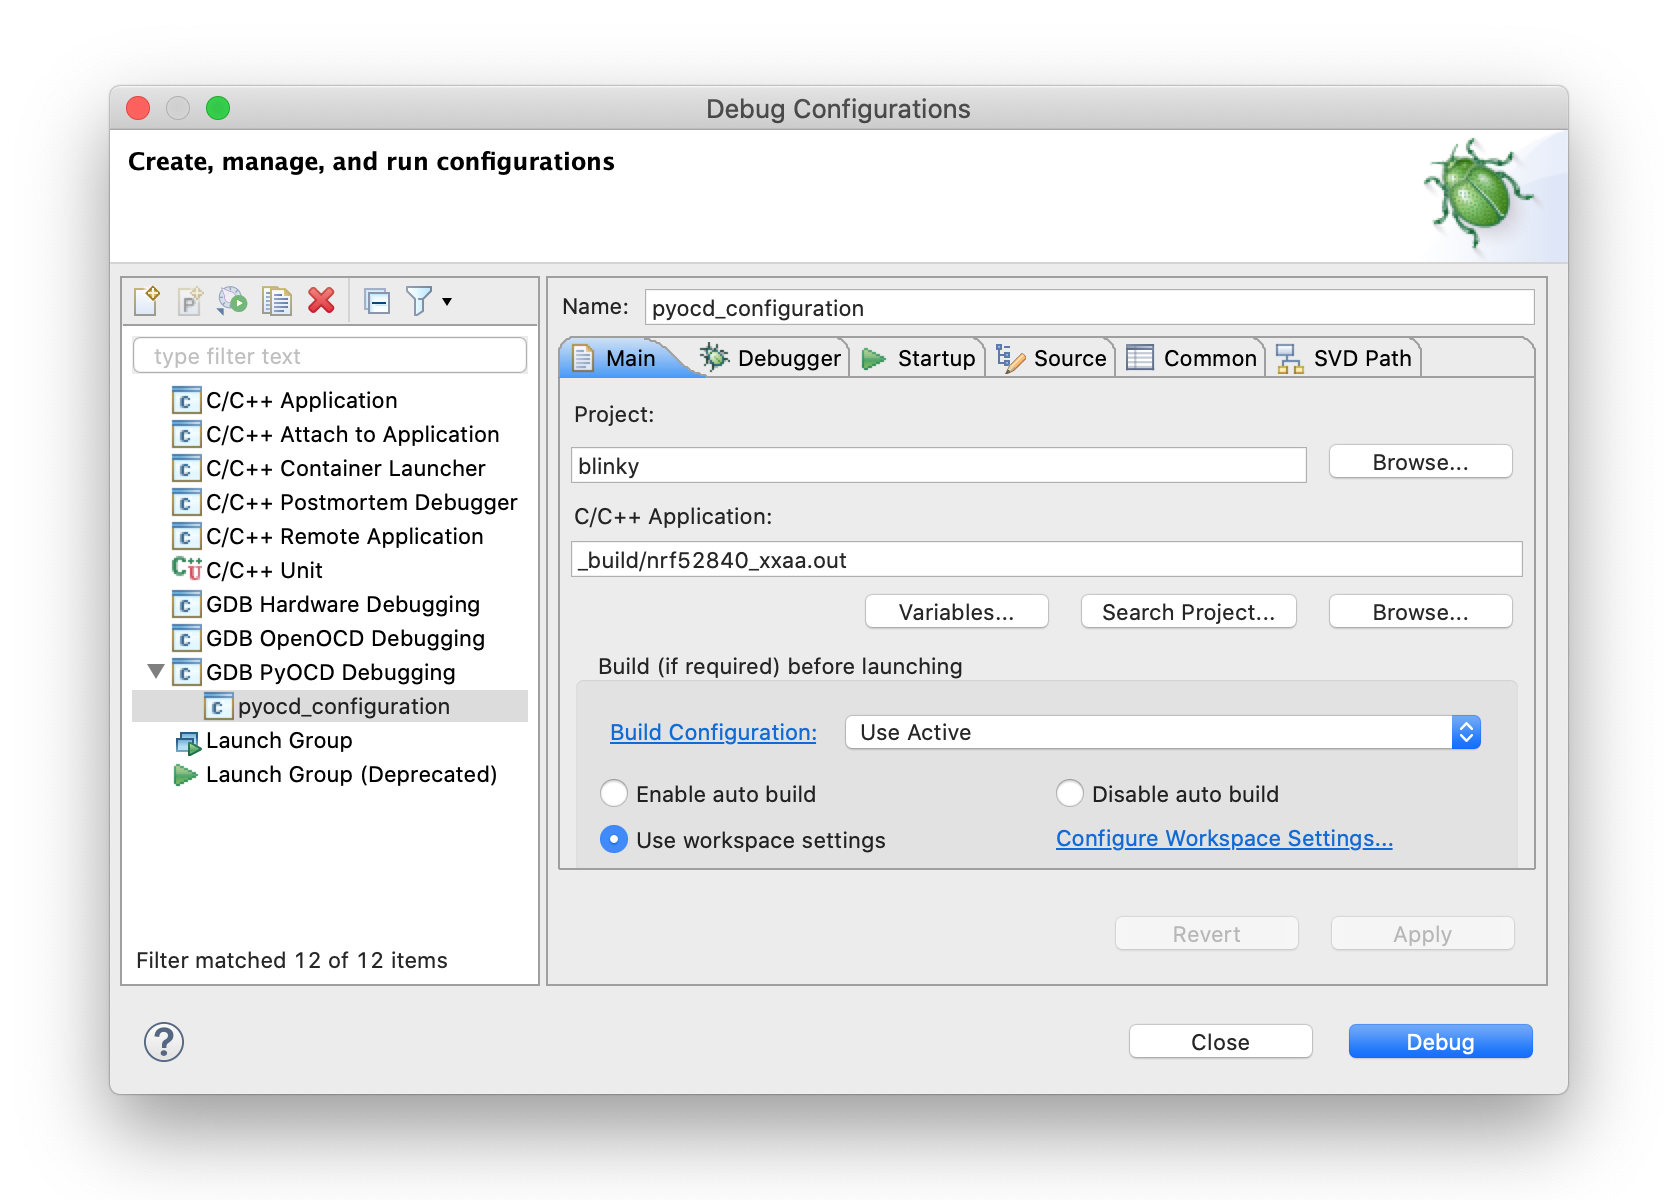
-
In the Debugger tab:
- Under pyOCD Setup, set the Executable path and make sure that it is pointing to your latest version of the
pyocd-gdbserver. - Under GDB Client Setup, set the Executable path to your
arm-none-eabi-gdb. - Click Apply.
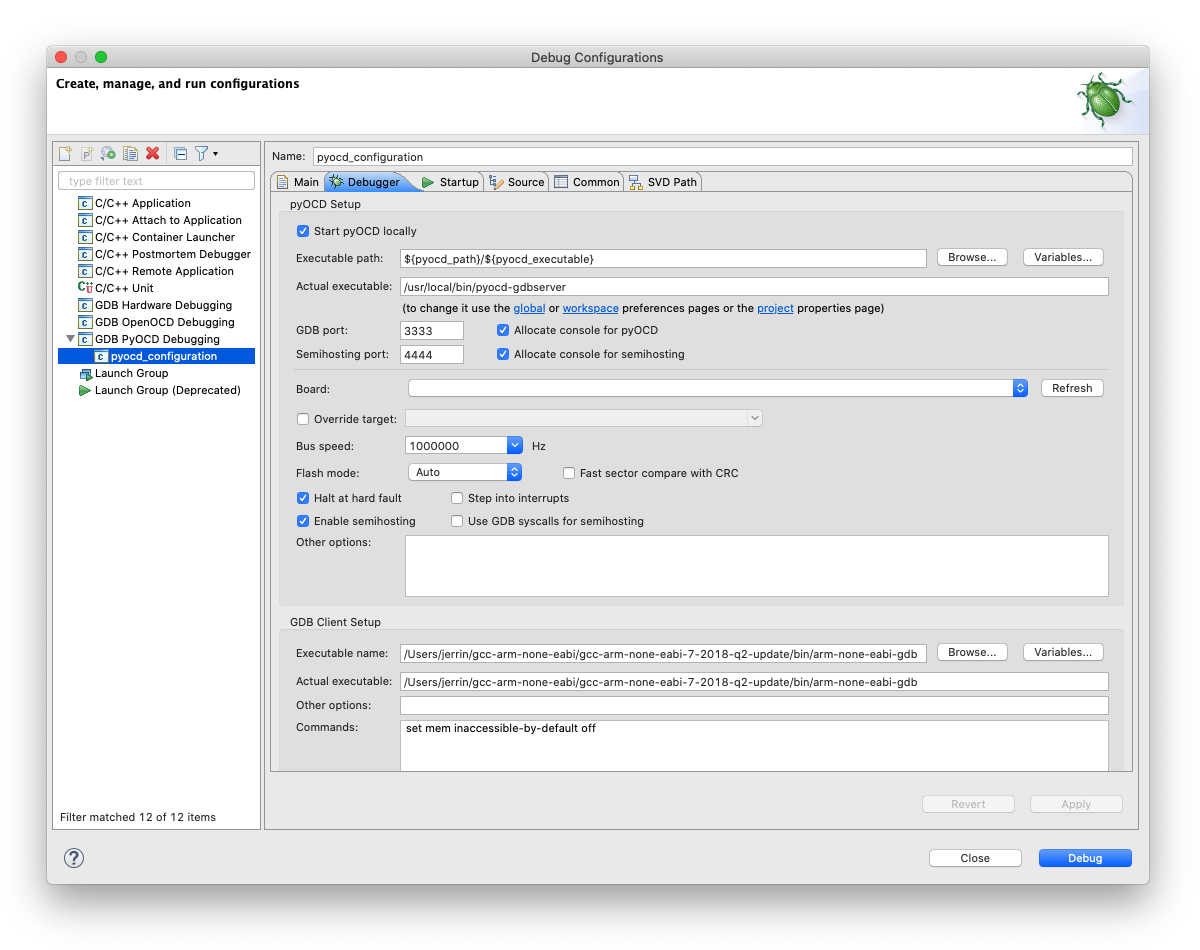
- Under pyOCD Setup, set the Executable path and make sure that it is pointing to your latest version of the
Tip
The which(on macOS/Linux) or where(on Windows) shell command can be used to find the location of pyocd-gdbserver and arm-none-eabi-gdb. E.g., which pyocd-gdbserver and which arm-none-eabi-gdb.
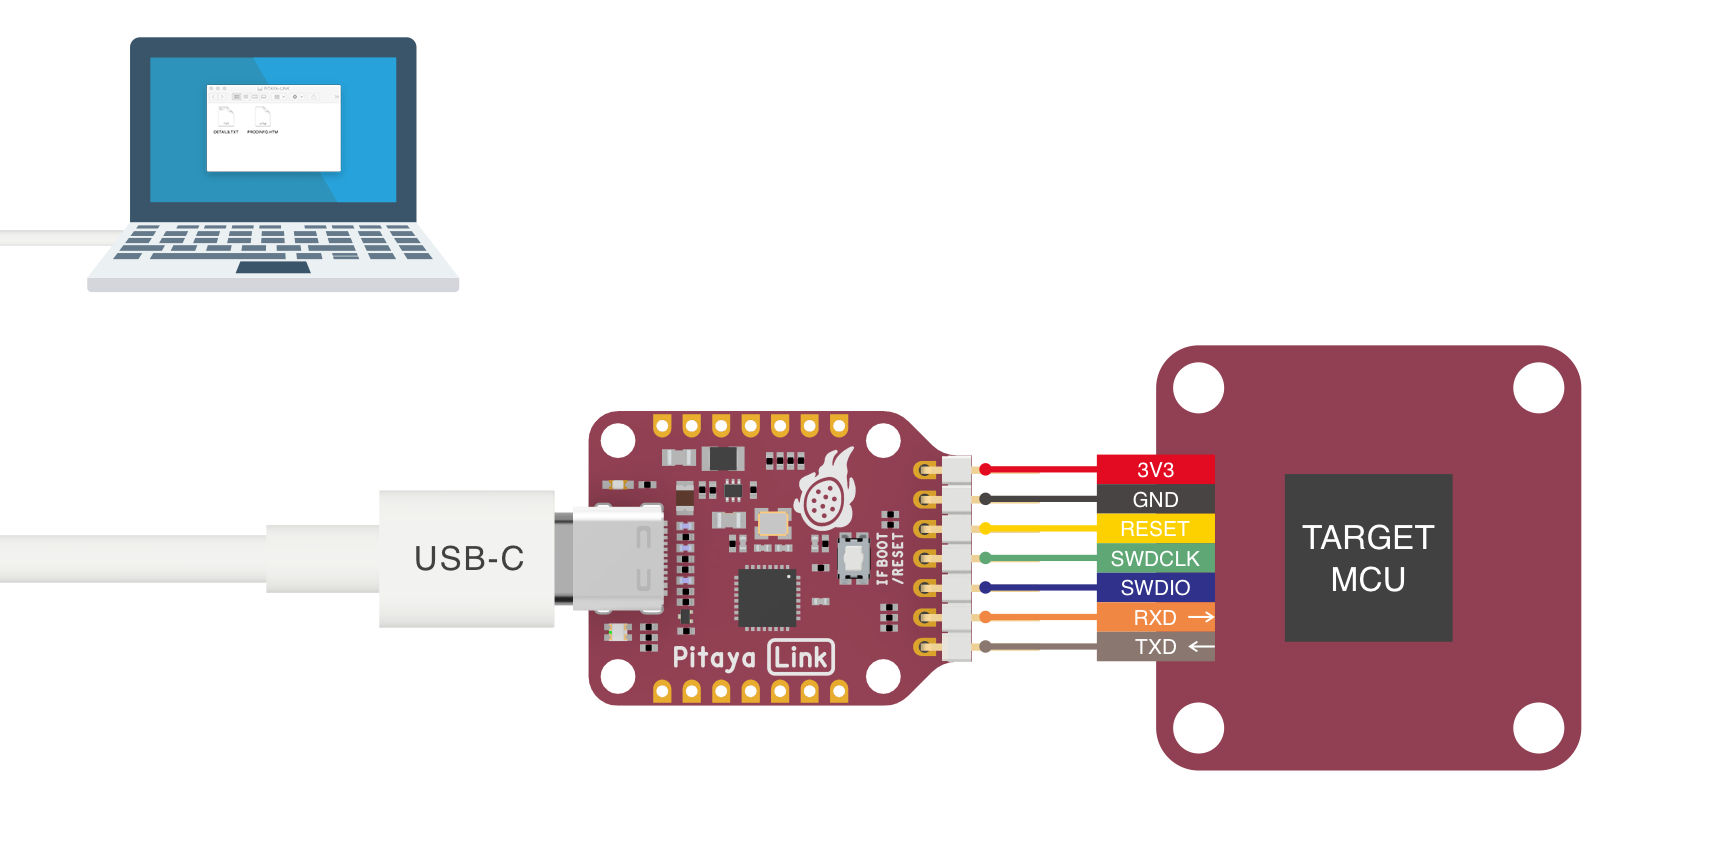
Connecting the target
Perform the following steps to connect the target board:
- Connect the target board to Pitaya-Link using the provided 7-pin Cable.
- Connect Pitaya-Link to the PC using the provided USB-C Cable.
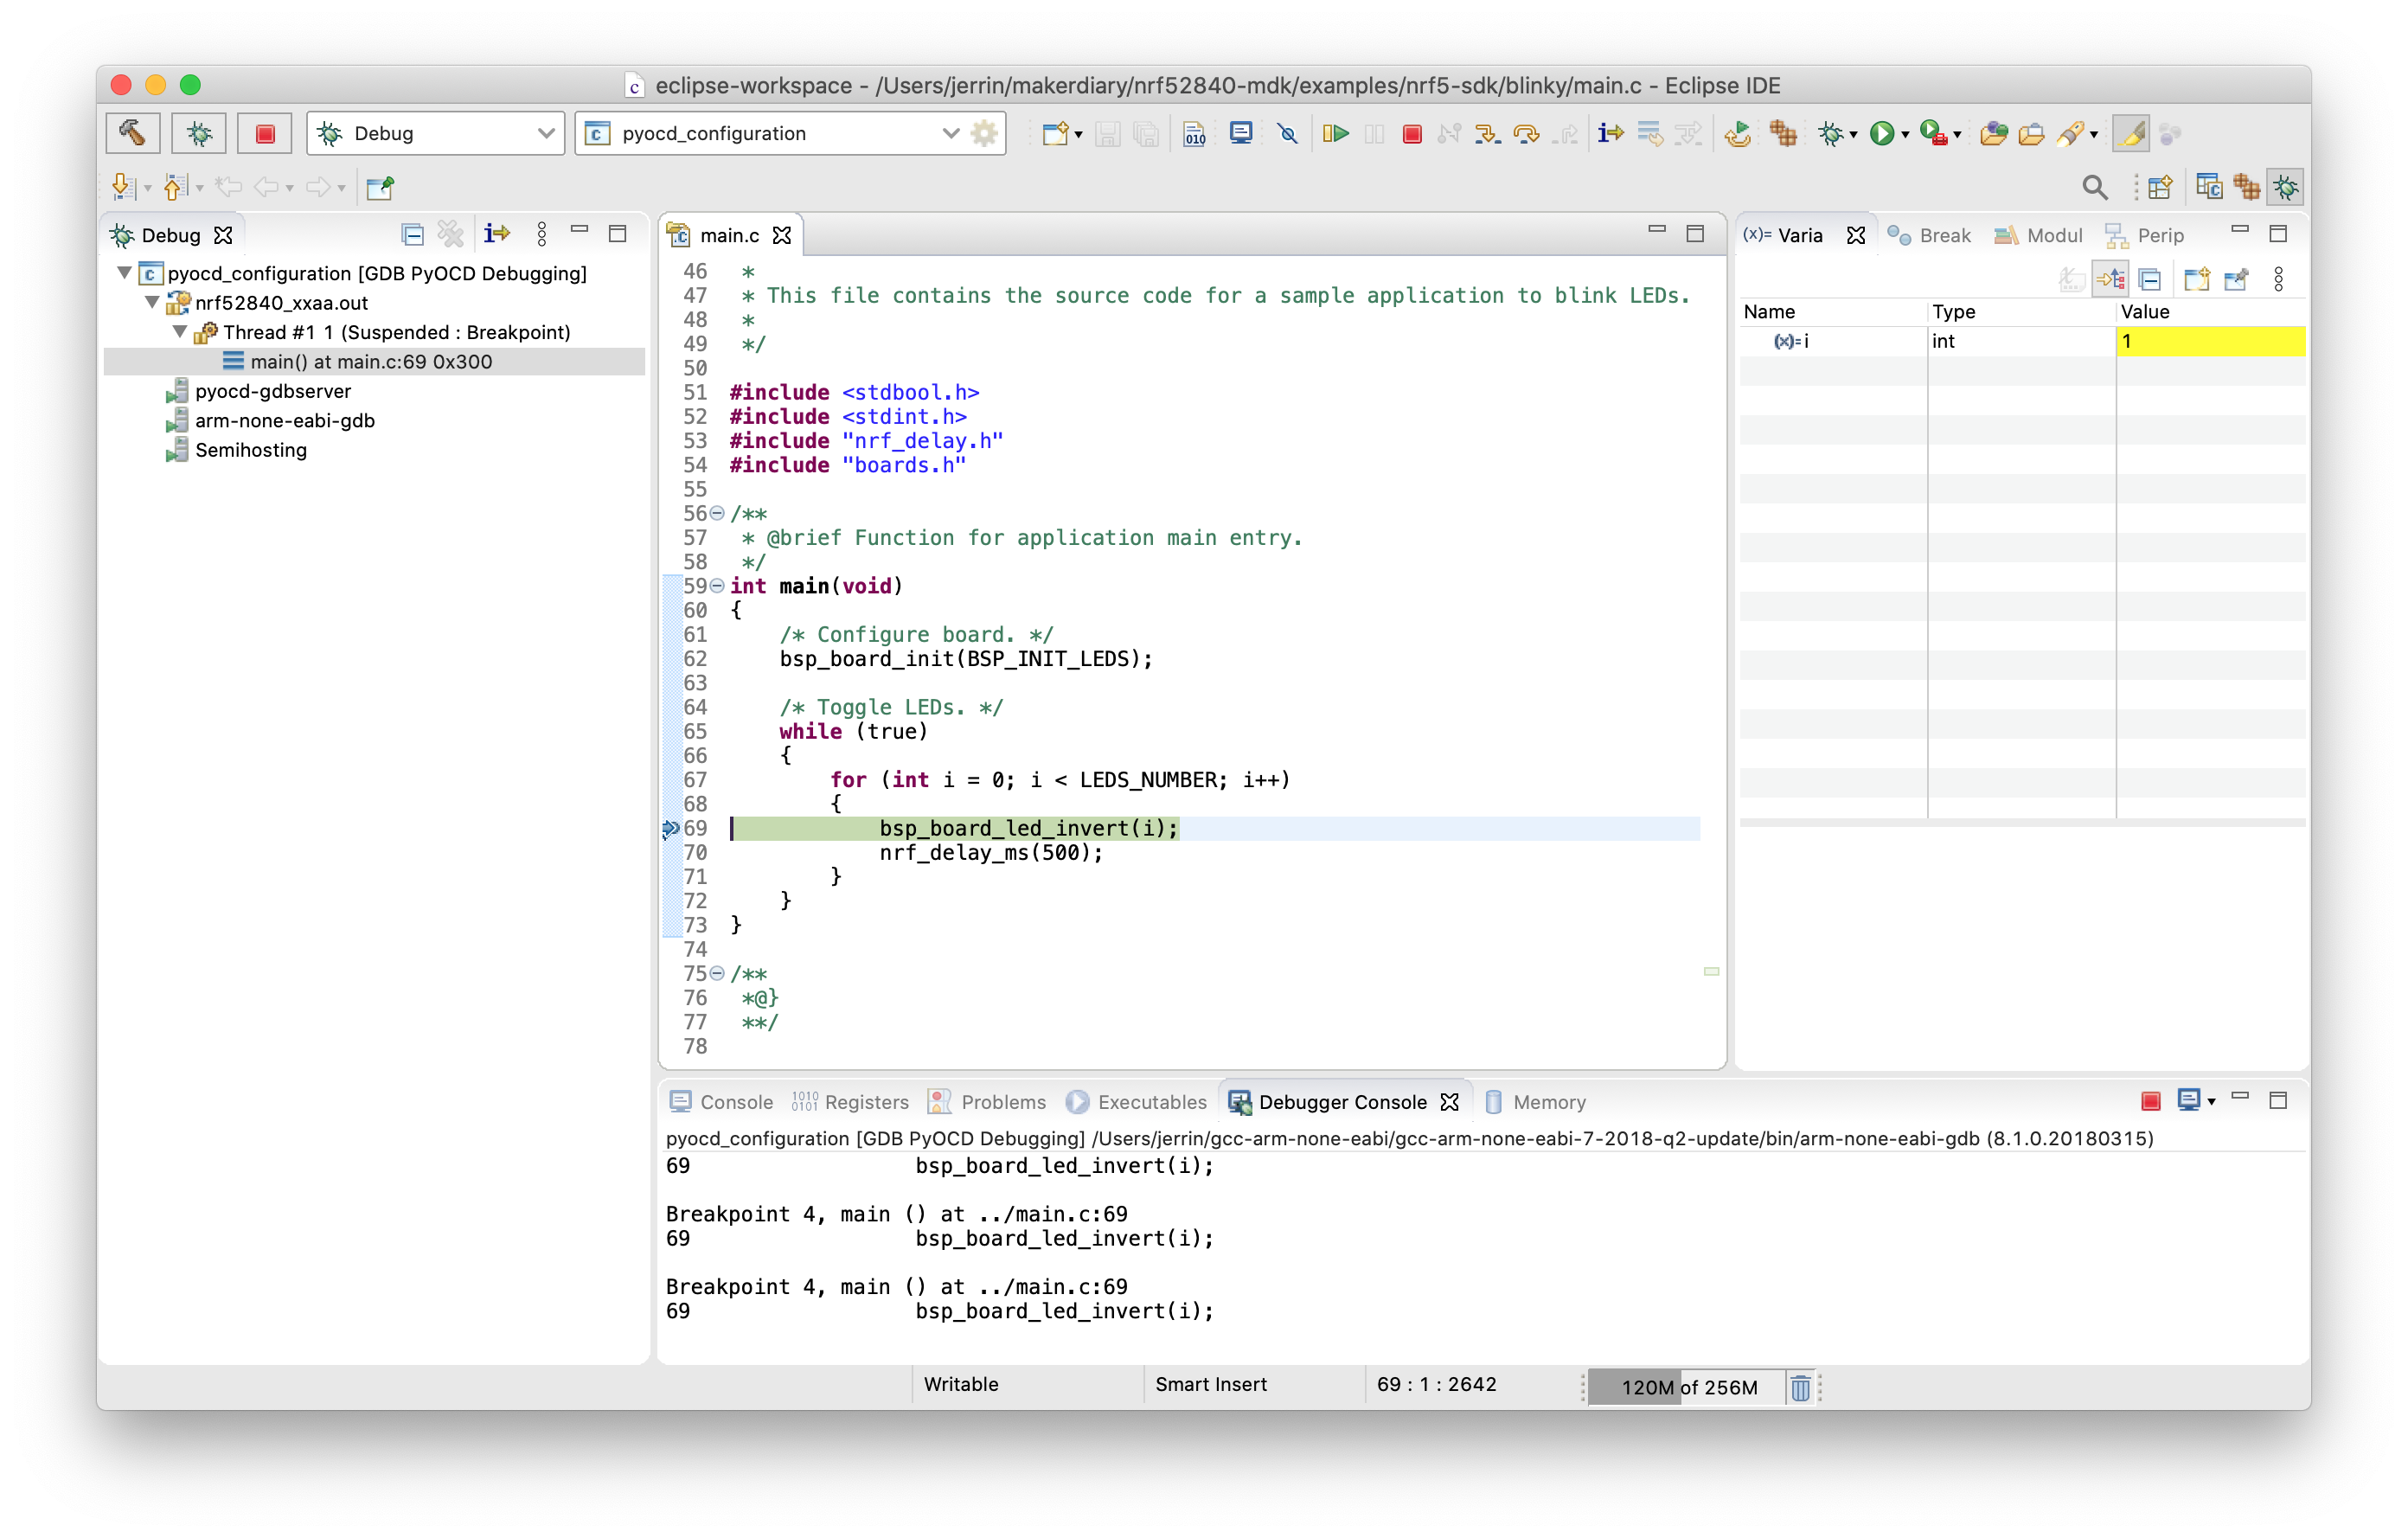
Debugging your project
Click the menu Run -> Debug, and debugging starts. Click on the Debugger Console tab to see the debug output:
Create an Issue
Interested in contributing to this project? Want to report a bug? Feel free to click here: