Using Pitaya-Link with Visual Studio Code
Introduction
This guide explains how to configure the local debug toolchain using Pitaya-Link with Visual Studio Code.
Requirements
- A Pitaya-Link Debug Probe
- Visual Studio Code
- An nRF52 target board (e.g. nRF52840 MDK USB Dongle)
Install Visual Studio Code
You need to install Visual Studio Code with the C/C++ extensions to begin.
-
Install Visual Studio Code.
-
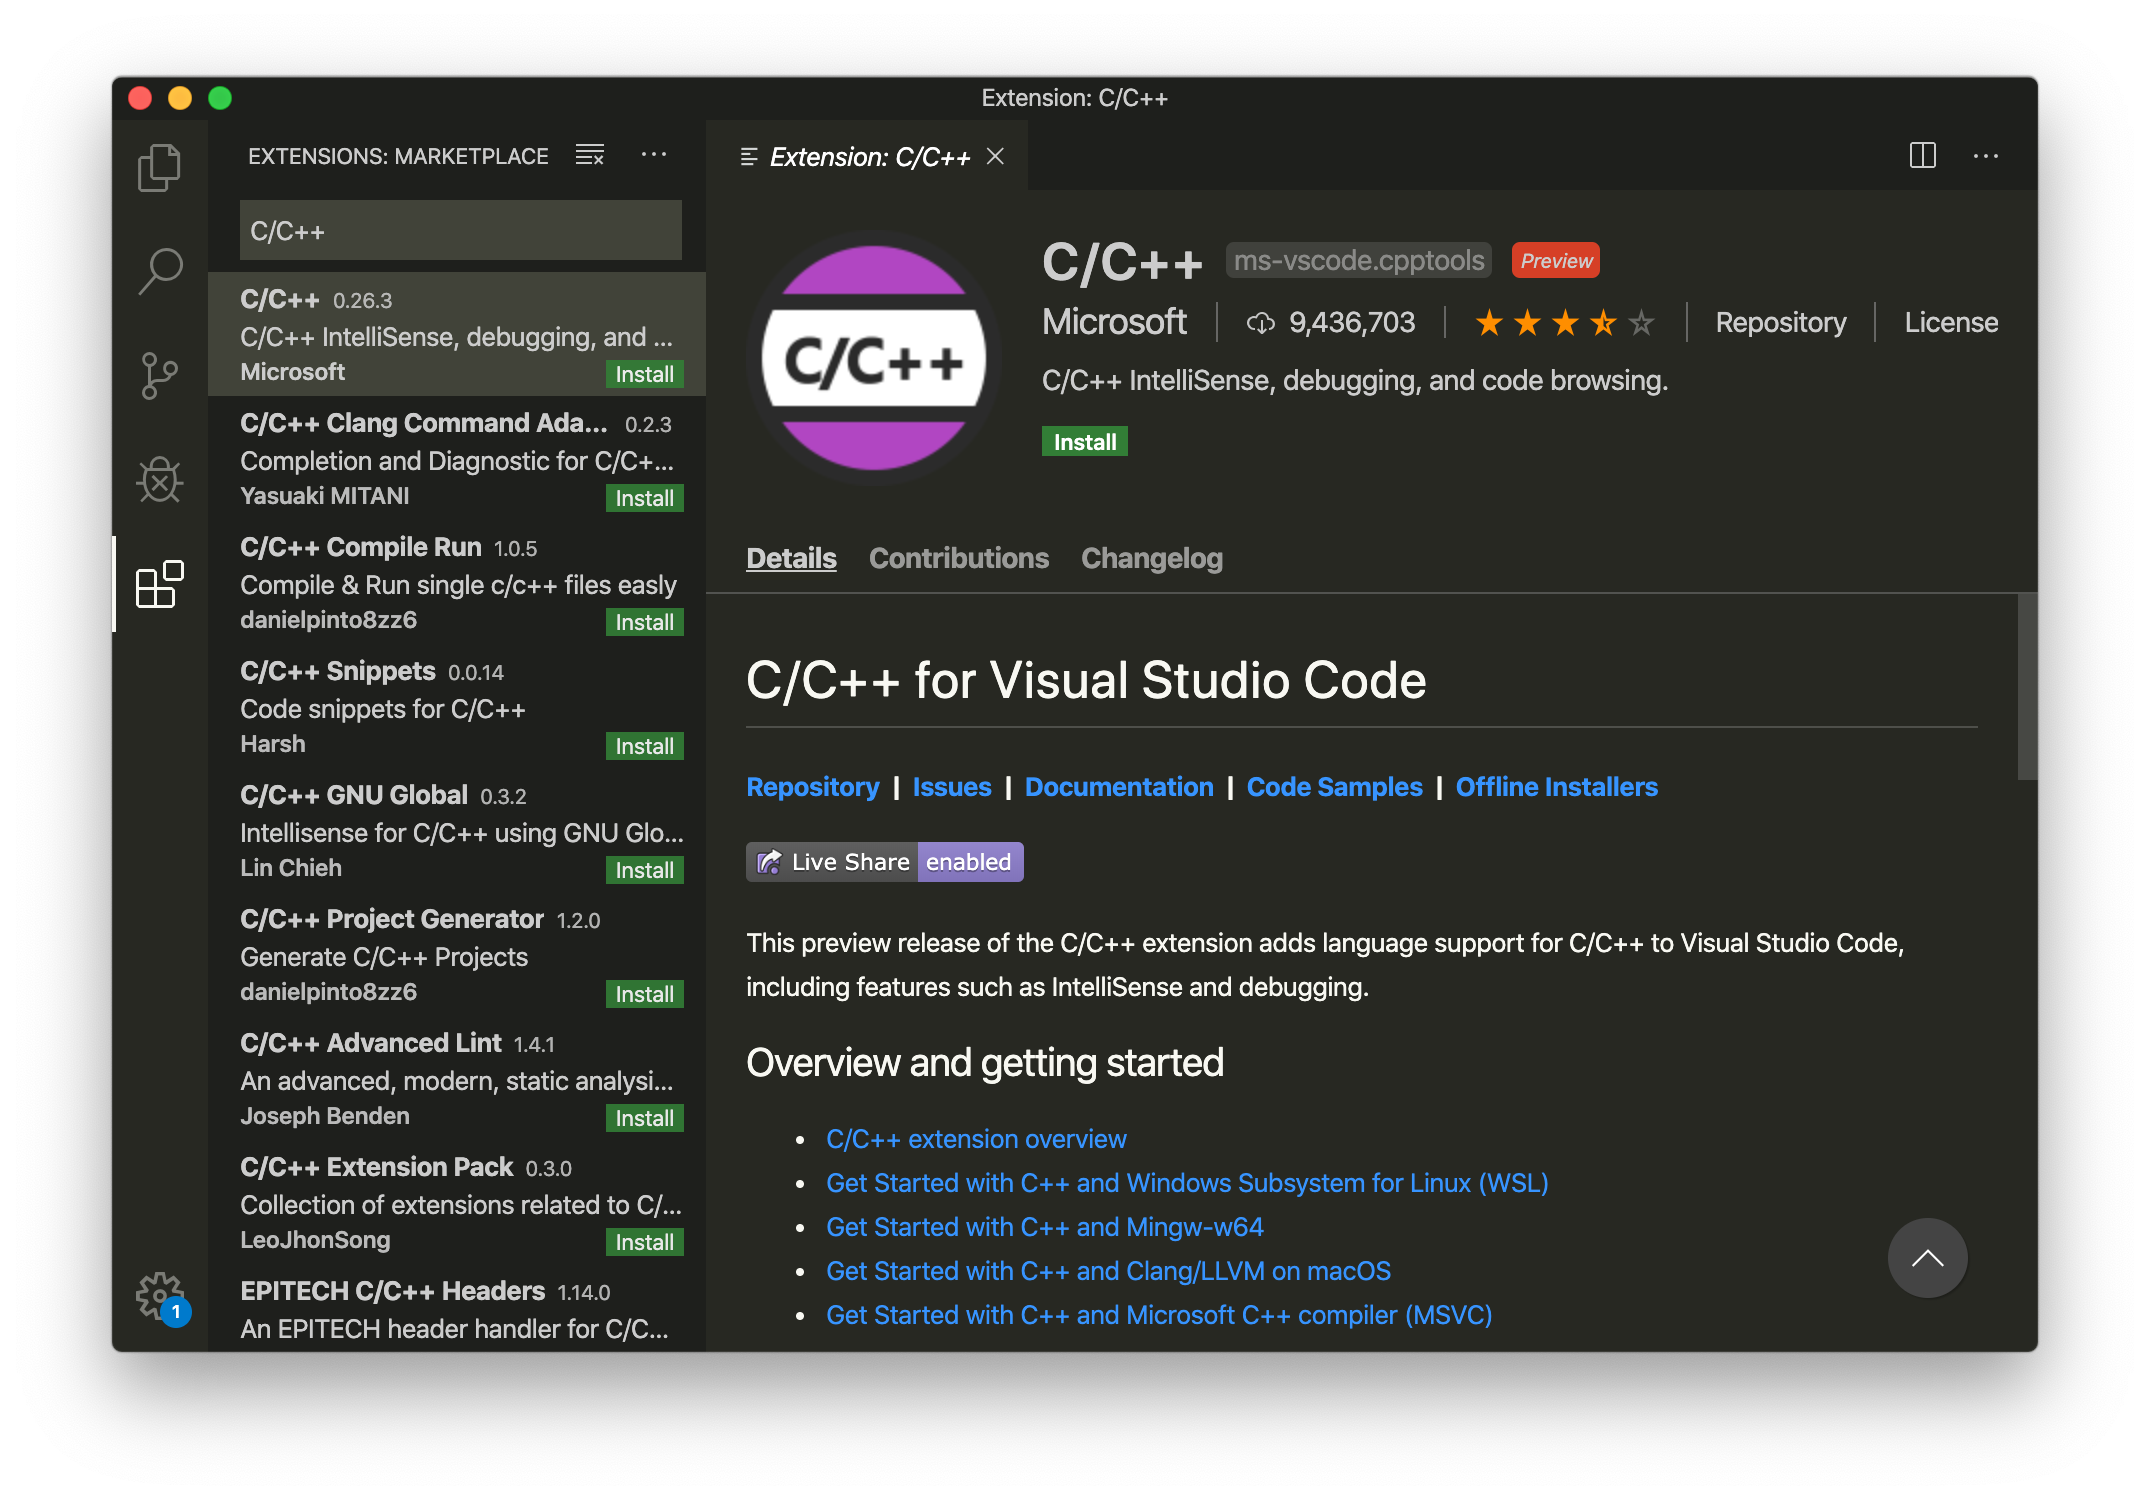
Open Visual Studio Code, and click on the Extensions button.
-
Search for the C/C++ plugin (by Microsoft) and click Install.
-
When prompted, restart the IDE.
Install pyOCD
The latest stable version of pyOCD may be installed via pip as follows. Skip this step if pyOCD already exists.
pip install -U pyocd
Install GNU Arm Embedded Toolchain
Download and install the GNU ARM Embedded Toolchain. Then ensure the path is added to your OS PATH environment variable:
# in ~/.bash_profile, add the following script
export PATH="<path to install directory>/gcc-arm-none-eabi-6-2017-q2-update/bin:${PATH}"
Type the following in your terminal to verify if arm-none-eabi-gcc works:
arm-none-eabi-gcc --version
Configuring the debugger
The launch.json file is used to configure the debugger in Visual Studio Code. Perform the following steps to configure the debugger for your project:
-
Open the project folder in Visual Studio Code.
-
Open the
.vscode/launch.jsonfile and add the example configurations:{ "version": "0.2.0", "configurations": [ { "name": "C++ Launch", "type": "cppdbg", "request": "launch", "program": "${workspaceRoot}/armgcc/_build/nrf52840_xxaa.out", "args": [], "stopAtEntry": true, "cwd": "${workspaceRoot}", "environment": [], "externalConsole": false, "debugServerArgs": "", "serverLaunchTimeout": 20000, "filterStderr": true, "filterStdout": false, "serverStarted": "GDB\\ server\\ started", "preLaunchTask": "make", "setupCommands": [ { "text": "-target-select remote localhost:3333", "description": "connect to target", "ignoreFailures": false }, { "text": "-file-exec-and-symbols ${workspaceRoot}/armgcc/_build/nrf52840_xxaa.out", "description": "load file", "ignoreFailures": false}, { "text": "-interpreter-exec console \"monitor endian little\"", "ignoreFailures": false }, { "text": "-interpreter-exec console \"monitor reset\"", "ignoreFailures": false }, { "text": "-interpreter-exec console \"monitor halt\"", "ignoreFailures": false }, { "text": "-interpreter-exec console \"monitor arm semihosting enable\"", "ignoreFailures": false }, { "text": "-target-download", "description": "flash target", "ignoreFailures": false } ], "logging": { "moduleLoad": true, "trace": true, "engineLogging": true, "programOutput": true, "exceptions": true }, "linux": { "MIMode": "gdb", "MIDebuggerPath": "arm-none-eabi-gdb", "debugServerPath": "pyocd-gdbserver" }, "osx": { "MIMode": "gdb", "MIDebuggerPath": "arm-none-eabi-gdb", "debugServerPath": "pyocd-gdbserver" }, "windows": { "preLaunchTask": "make.exe", "MIMode": "gdb", "MIDebuggerPath": "arm-none-eabi-gdb.exe", "debugServerPath": "pyocd-gdbserver.exe", "setupCommands": [ { "text": "-environment-cd ${workspaceRoot}\\armgcc\\_build" }, { "text": "-target-select remote localhost:3333", "description": "connect to target", "ignoreFailures": false }, { "text": "-file-exec-and-symbols nrf52840_xxaa.out", "description": "load file", "ignoreFailures": false}, { "text": "-interpreter-exec console \"monitor endian little\"", "ignoreFailures": false }, { "text": "-interpreter-exec console \"monitor reset\"", "ignoreFailures": false }, { "text": "-interpreter-exec console \"monitor halt\"", "ignoreFailures": false }, { "text": "-interpreter-exec console \"monitor arm semihosting enable\"", "ignoreFailures": false }, { "text": "-target-download", "description": "flash target", "ignoreFailures": false } ] } } ] }
-
Create a
maketask in.vscode/tasks.jsonfile:{ // See https://go.microsoft.com/fwlink/?LinkId=733558 // for the documentation about the tasks.json format "version": "2.0.0", "tasks": [ { "label": "make", "options": { "cwd": "${workspaceRoot}/armgcc" }, "problemMatcher": { "owner": "cpp", "fileLocation": ["relative", "${workspaceRoot}"], "pattern": { "regexp": "^(.*):(\\d+):(\\d+):\\s+(warning|error):\\s+(.*)$", "file": 1, "line": 2, "column": 3, "severity": 4, "message": 5 } }, "args": [], "linux": { "command": "make" }, "osx": { "command": "make" }, "windows": { "command": "make.exe" } } ] }
Connecting the target
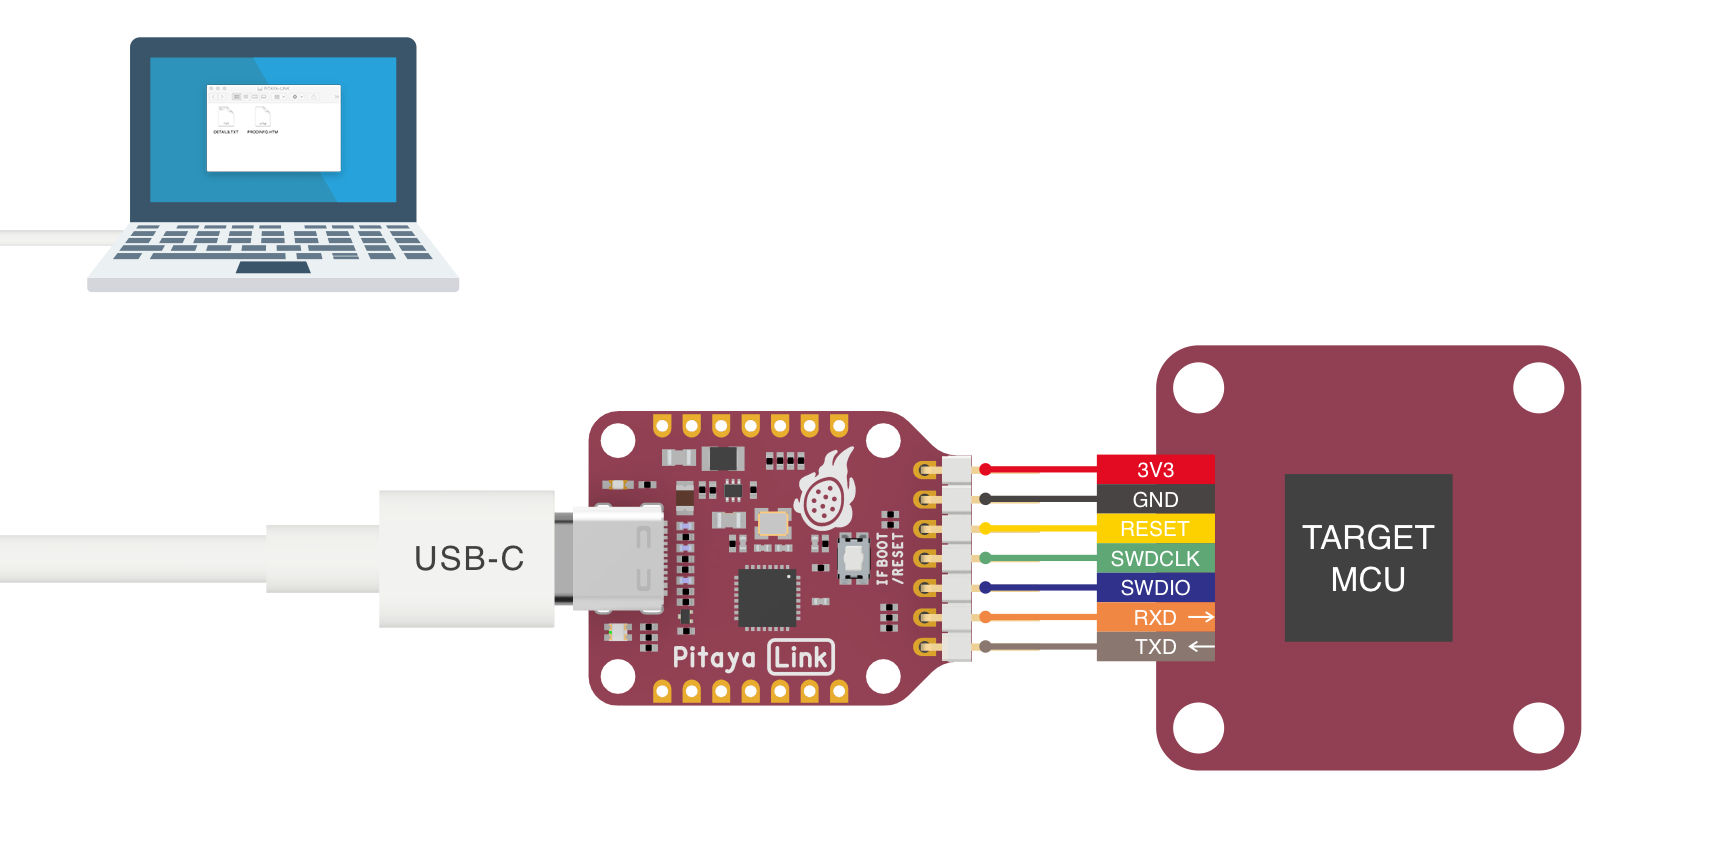
Perform the following steps to connect the target board:
- Connect the target board to Pitaya-Link using the provided 7-pin Cable.
- Connect Pitaya-Link to the PC using the provided USB-C Cable.
Debugging your project
Click the menu Debug -> Start Debugging, and debugging starts. Click on the DEBUG CONSOLE tab to see the debug output:
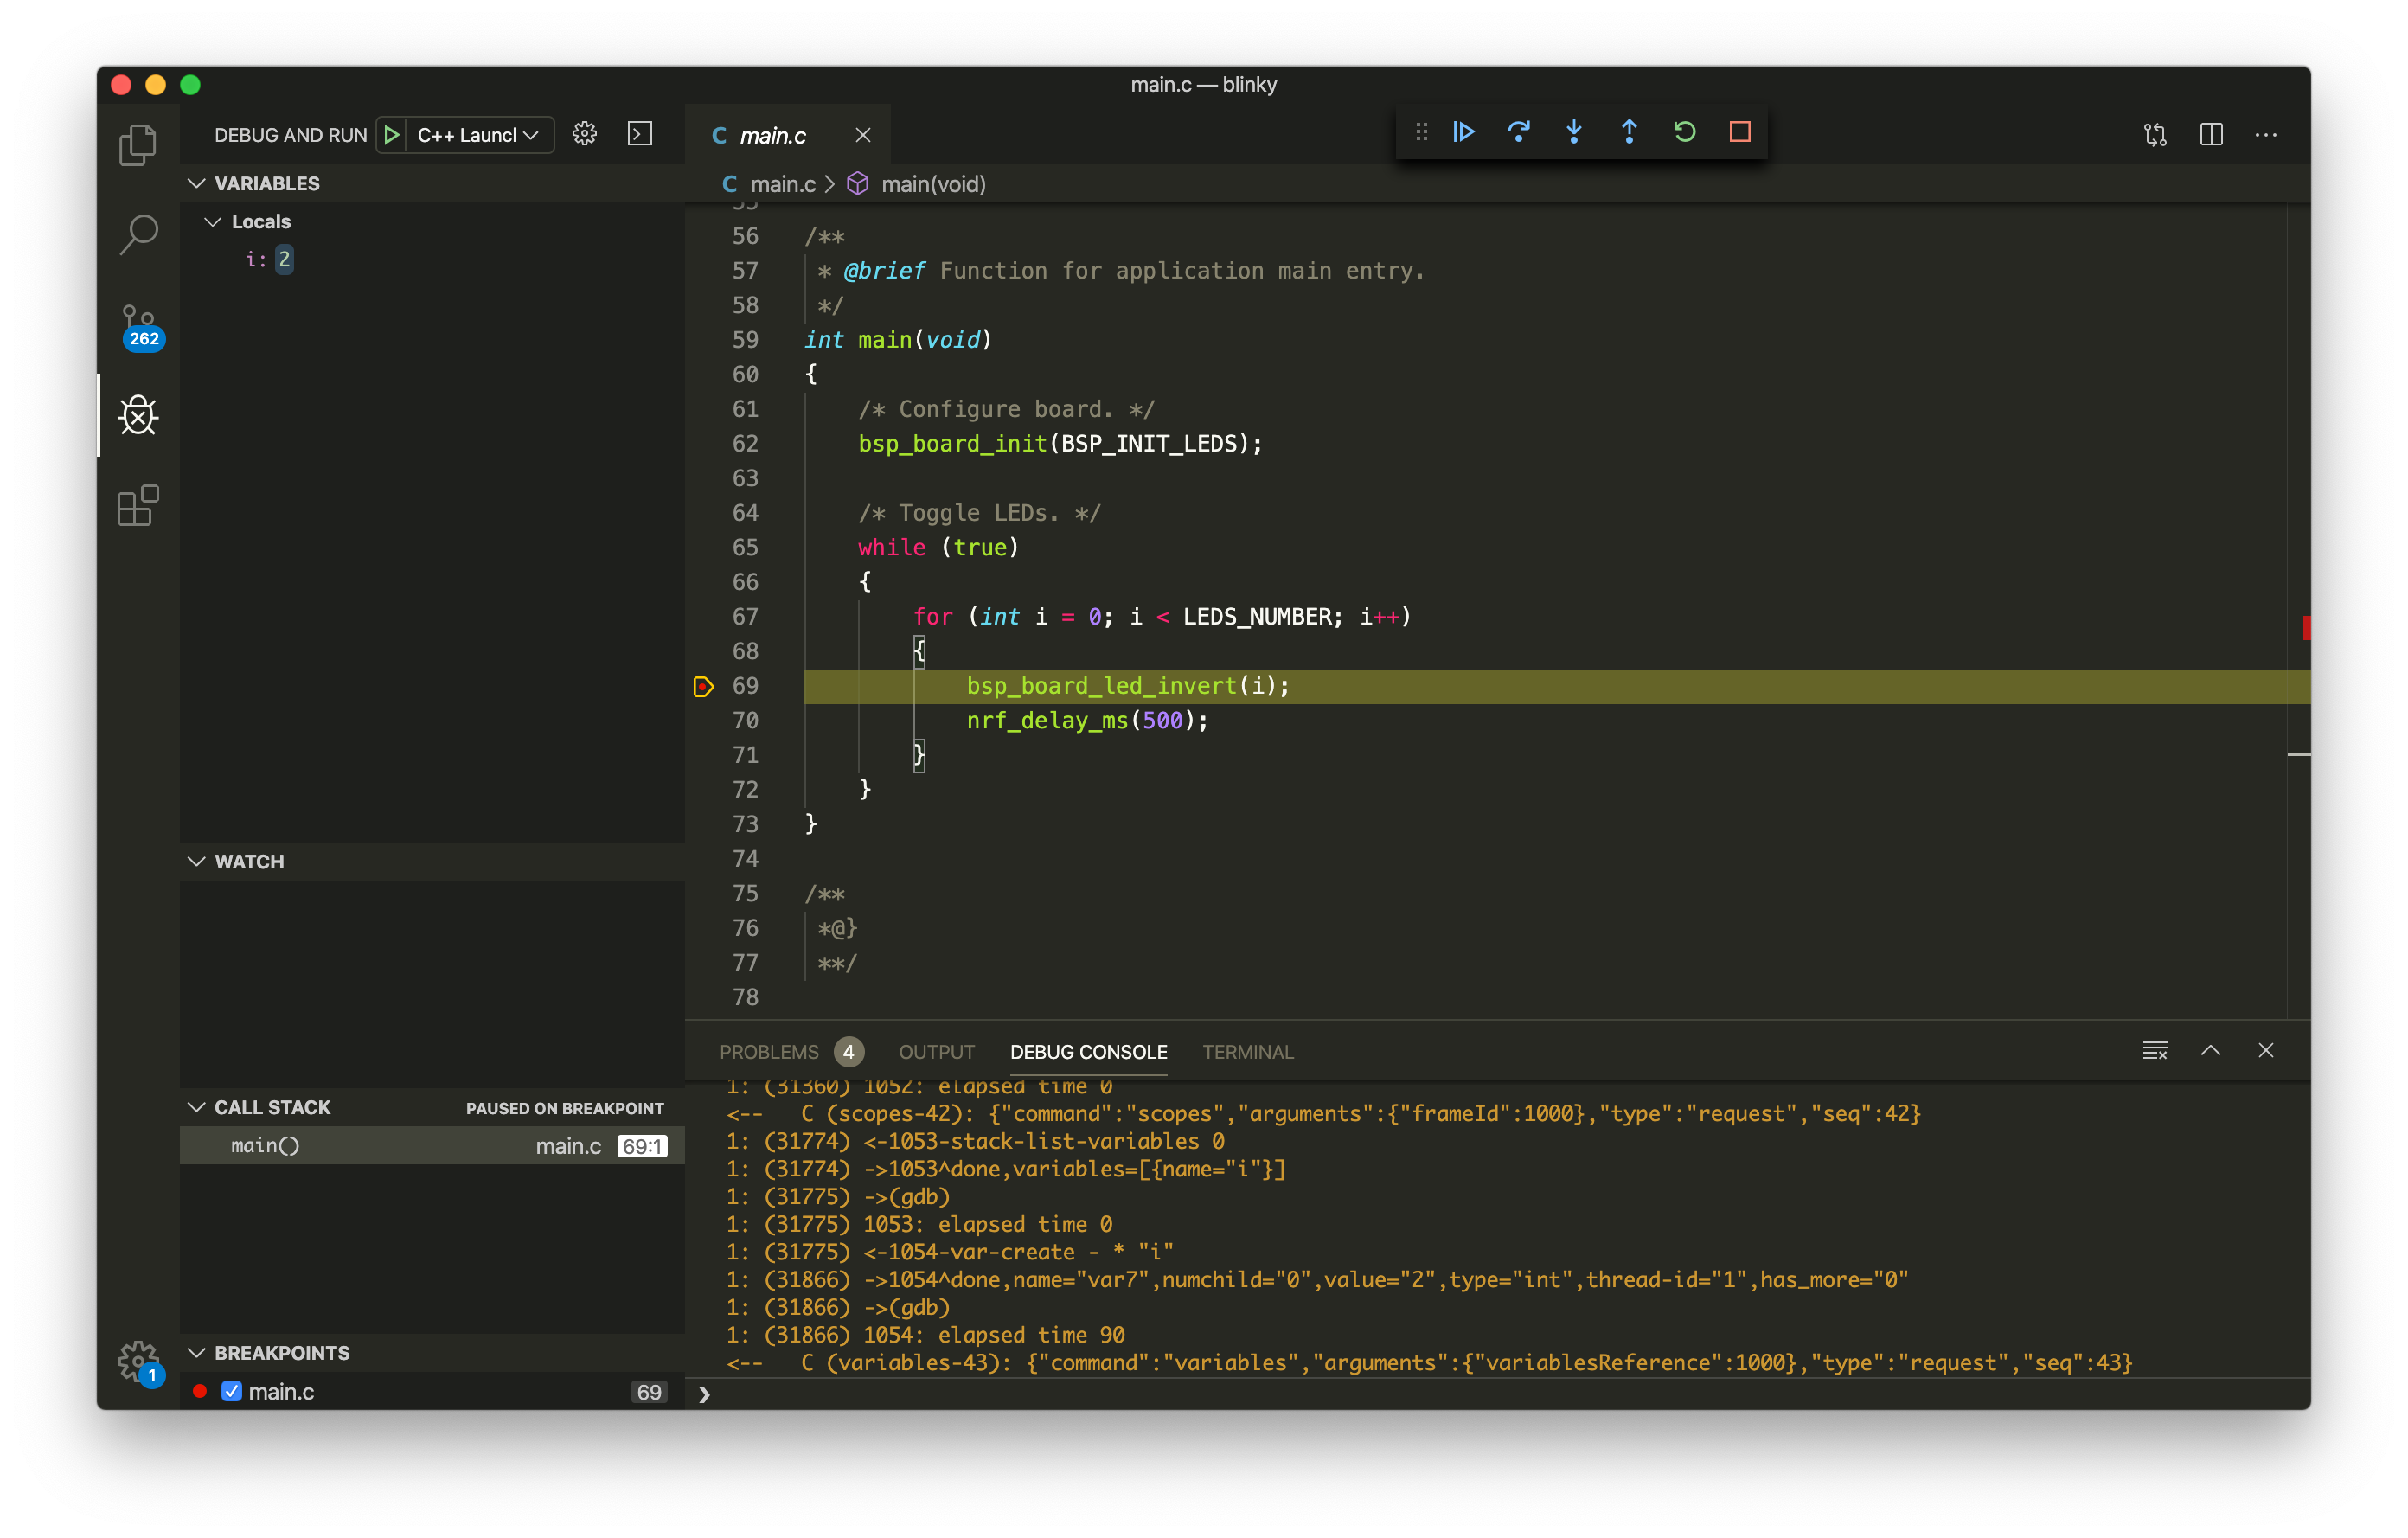
Now you can explore the debugging capabilities for Variables, Breakpoints and more.
Example Sources
The example project files we are using in this guide are located in GitHub:
Reference
Create an Issue
Interested in contributing to this project? Want to report a bug? Feel free to click here: