Thread Topology Monitor
This section describes how to set up the nRF Thread Topology Monitor to visualize the current network topology.
Introduction
nRF Thread Topology Monitor is a cross-platform tool that enables developers to visualize Thread mesh network topology in real time. The tool is supported on Windows and Linux with separate downloads for each platform. It requires a serial connection to an nRF52840 board with Nordic’s Thread solution.
nRF Thread Topology Monitor uses diagnostic mechanisms of the Thread protocol to retrieve information about routing tables of each Thread Router currently attached to the network. The tool also allows to identify a particular device in the network using LEDs by interacting with the Thread BSP solution. You may assign a custom label to a Thread node and store it in persistent memory on the PC side, which helps to track topology changes.
Installation
-
Navigate to nRF Thread Topology Monitor page and download one of the following packages:
- Windows: nRF_TTM-win32-x64_v0.12.0-1.alpha
- Linux: nRF_TTM-linux-x64_v0.12.0-1.alpha.tar.gz
-
Extract the package.
-
Run the nRF Thread Topology Monitor executable file
nRF_TTM.
Flashing the OpenThread CLI
nRF Thread Topology Monitor requires OpenThread CLI firmware running on your board. The firmware is located in pitaya-go/firmware/openthread/cli with the name thread_cli_ftd_usb_pitaya_go_vx.x.x.
While pushing the USER button, press the RESET button to enter the DFU (Device Firmware Update) mode. Then program the firmware using the nRF Connect for Desktop tool.
Tip
See Programming section for details about how to program your Pitaya Go.
Viewing network topology
The following steps will show you how to set up the nRF Thread Topology Monitor:
- Connect Pitaya Go to your PC using the USB-C cable.
- In the navigation bar, click Select serial port.
- Click the Show all button in the dropdown menu and select the serial port.
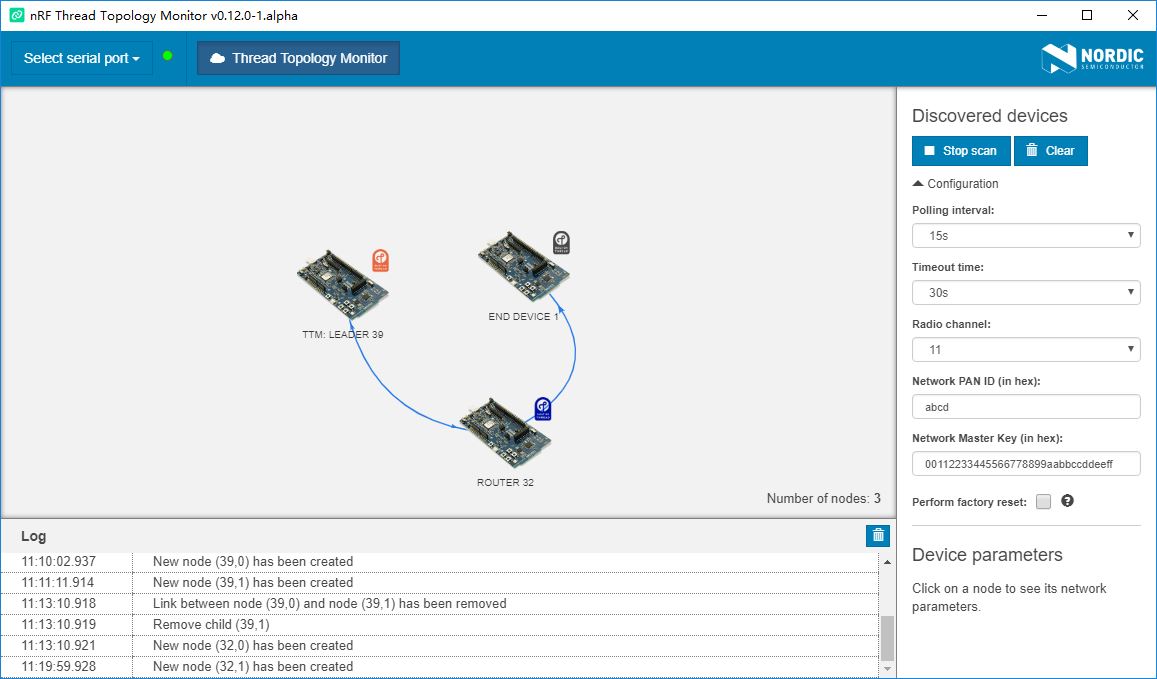
- Click Start scan to attach the board to the Thread network and to start polling nodes to get information on the current topology.
- Try to attach other Thread devices to the network. The nRF Thread Topology Monitor will visualize them as shown in the figure below.
Tip
During the device configuration, you can specify the parameters of the Thread Network:
- Radio channel
- Network PAN ID
- Network Master Key
Reference
Create an Issue
Interested in contributing to this project? Want to report a bug? Feel free to click here: